01INFRASTRUCTURE
Internet could not be trusted
Some branches experienced outages lasting hours or even days. Daily data entry could not depend on a continuously available cloud service.
CONSTRAINT → LOCAL-FIRST STORAGE
Clinical Laboratory Management System began as a solution to an operational challenge: manage clients, services, sales and reports across laboratory branches where internet access could disappear for hours or days. The result connected Python, SQLite and Excel automation in a desktop-first workflow.
The biggest outcome was not a model or an algorithm. It was learning how to design useful data systems around the people, constraints and tools of a real organization.
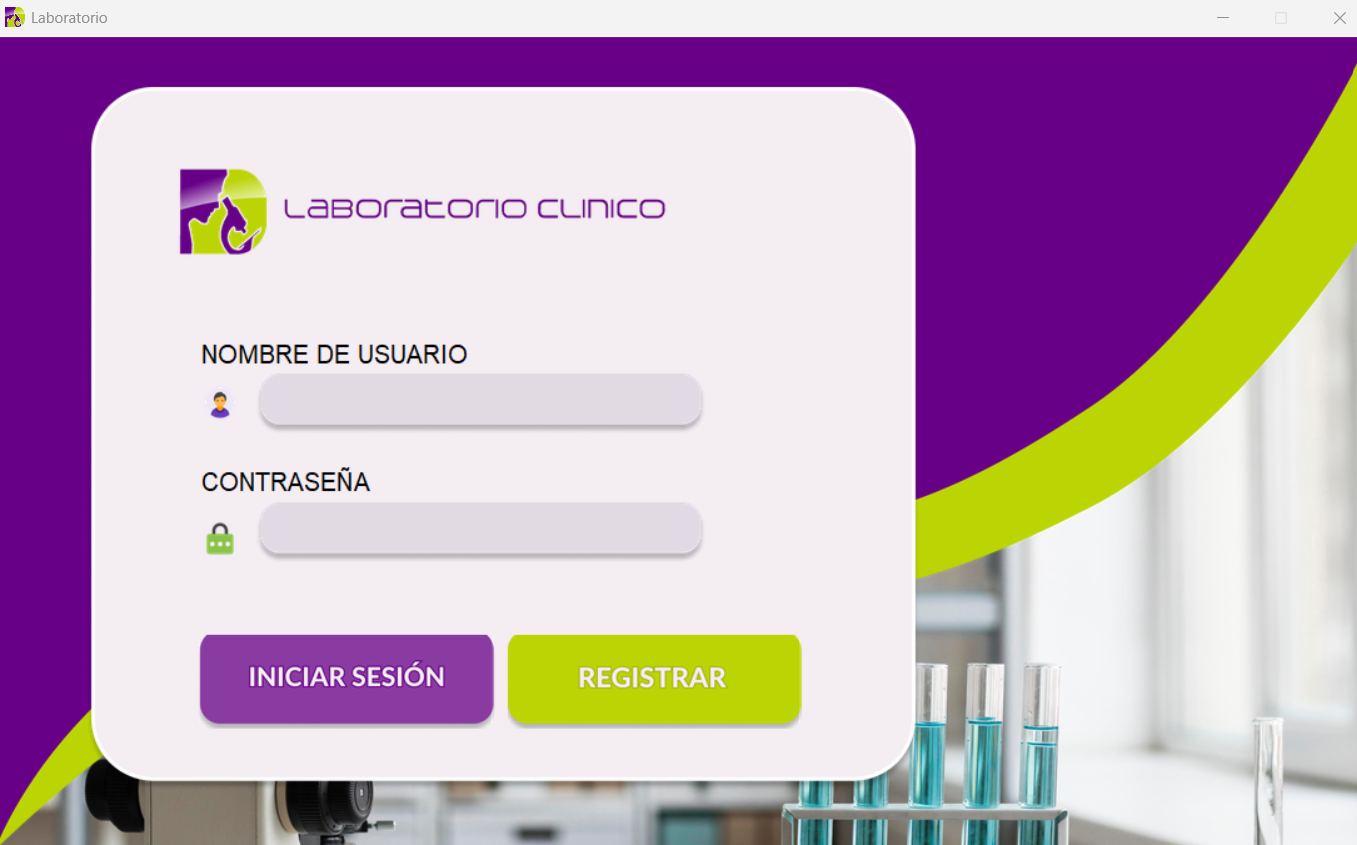
A business application is successful when it fits its users' actual workflow. Here, unreliable connectivity and mandatory spreadsheet formats were requirements, not edge cases.
Some branches experienced outages lasting hours or even days. Daily data entry could not depend on a continuously available cloud service.
Laboratory staff needed documents with specific information and layouts. Replacing spreadsheets altogether would have disrupted existing work.
Clients, studies, sales, payment information and historical activity needed to be organized so records could be retrieved and summarized consistently.
The diagram is a conceptual overview of the workflow, not a disclosure of private infrastructure or exact production schemas.
Excel files with patient, study and collection-related details
Excel summaries of sales, amounts and calculated indicators
Local use does not imply automatic synchronization between branches. Transfer and backup workflows must be managed separately.
The original system supported several administrative processes. The public demo reproduces their essential concepts using fictitious data and a simplified interface.
Store and retrieve client information for ongoing transactions and historical consultation.
Maintain a searchable catalog of laboratory studies, prices and associated information.
Register selected services, quantities, transaction totals, identifiers and payment information.
Explore registered operations and use filters such as date, customer, service or branch.
Transform recorded information into operational spreadsheets and economic reports.
Exchange structured information with Excel and support local data-management routines.
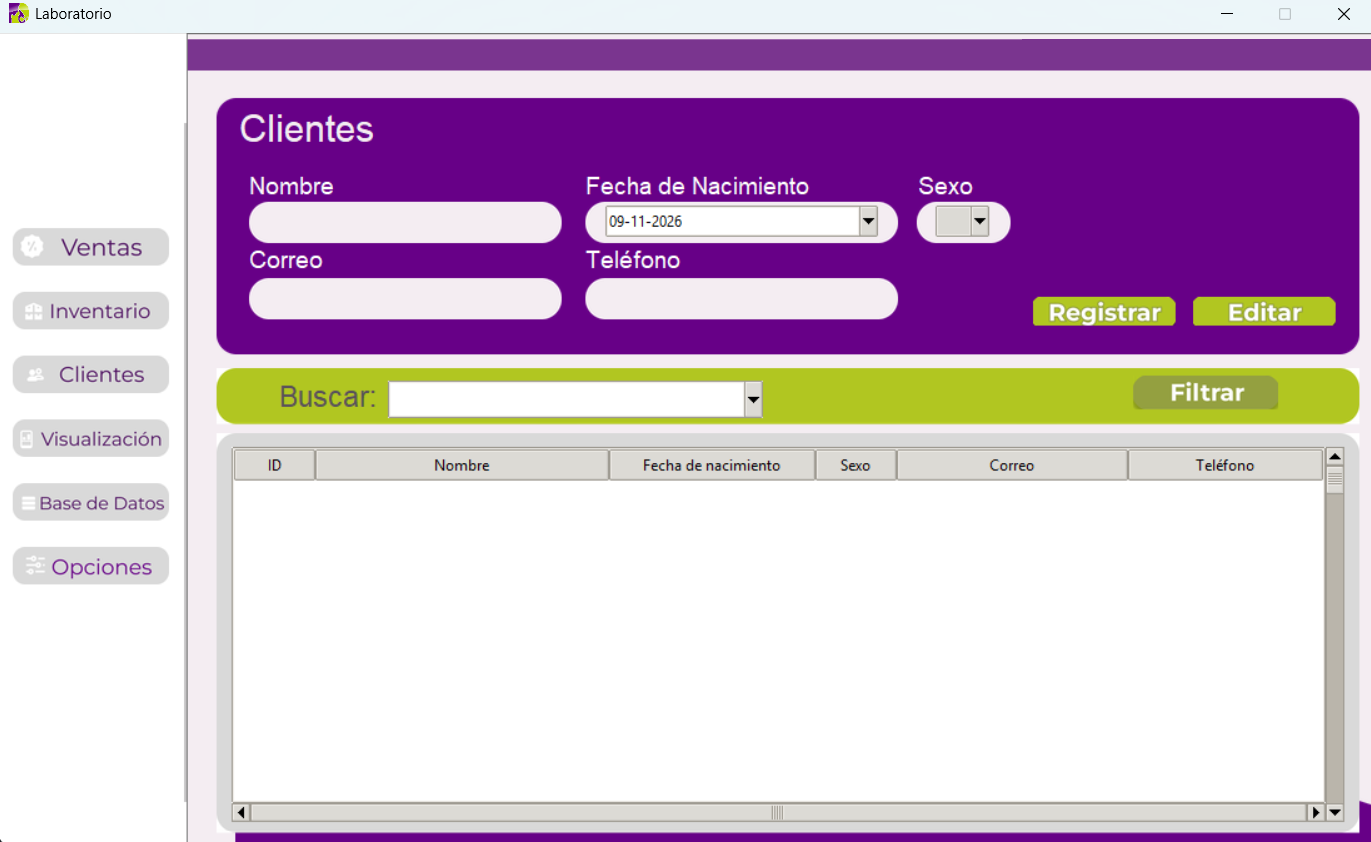
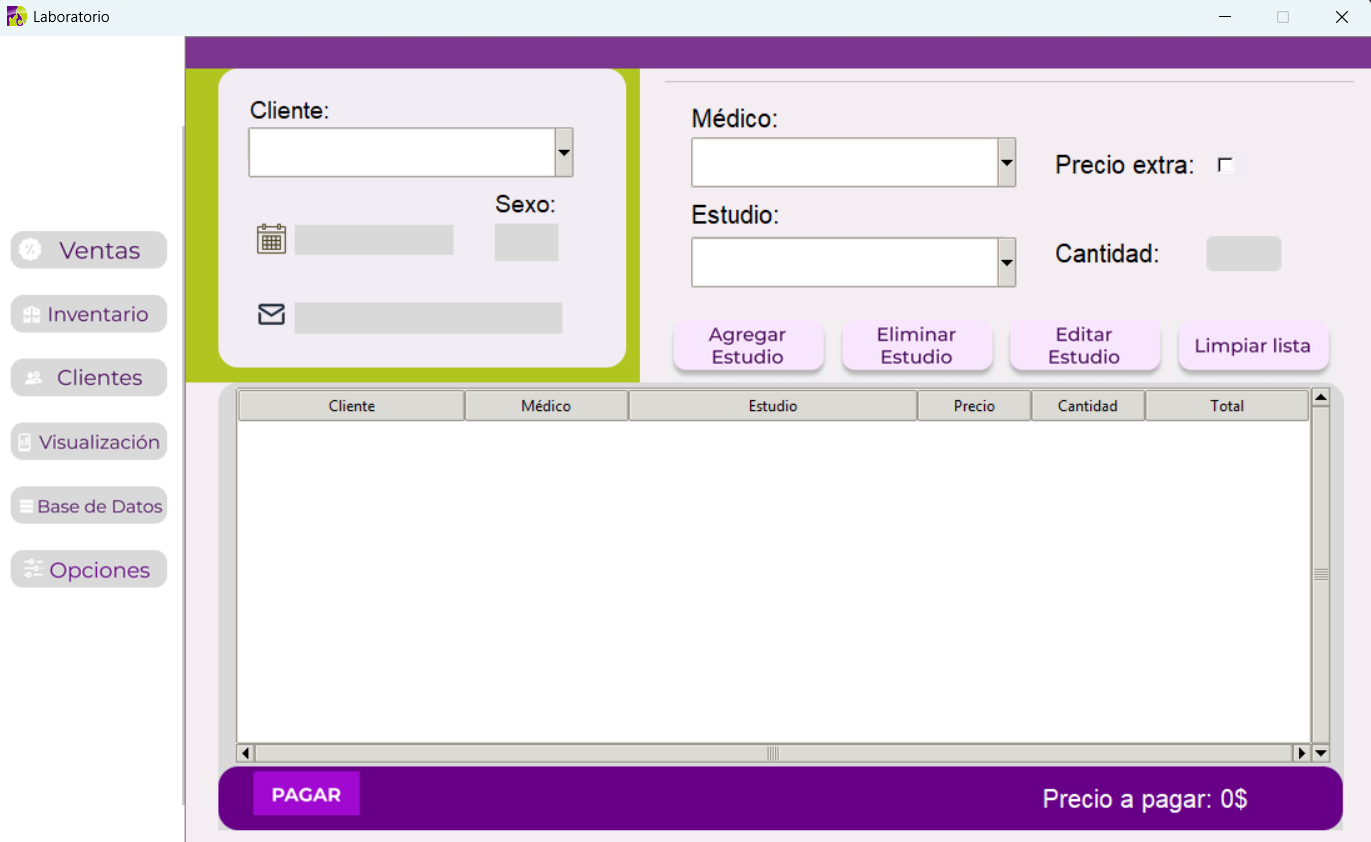
Screenshots should show only synthetic data from the public demonstration.
Excel was a business requirement. The important engineering task was not merely writing an .xlsx file, but producing the right information for the right team.
Used by laboratory staff to access the information associated with selected patient transactions during a chosen date range.
Designed for reviewing the financial activity represented by recorded transactions over a selected period.
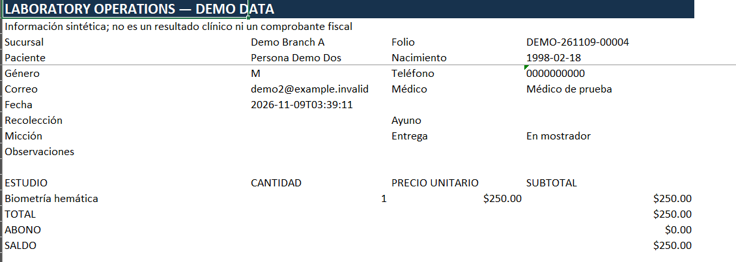

Both Excel screenshots must use fictitious patient and business information.
A single set of structured records can produce different outputs without duplicating the original data-entry process.
The data-related skills in this project are not predictive modeling. They are the steps that make business information consistent, queryable and reportable.
Structured tables and queries support transactional records and history without requiring a network connection for local operations.
Prepare tabular records for summaries, clean data types and aggregate information for administrative reporting.
Produce spreadsheets that match established laboratory and business workflows rather than forcing a new file format.
The linked repository is intended to showcase a separately implemented, privacy-conscious demonstration of the project's core workflows.
The public version uses demo records, generic visual elements and local SQLite storage. It does not contain actual client data, internal business documents, production credentials or original company branding.
Explore the repository ↗$ python scripts/init_demo.py › Synthetic dataset initialized $ python main.py › Local desktop application # No production data required
The commands illustrate the demonstration workflow; see the repository README for current setup instructions. The conceptual preview above is not a screenshot of either application.
This project changed how I think about data work: solving the right operational problem often matters more than choosing the most sophisticated technology.
Building an offline-first tool for real operational workflows taught me that good software must respect infrastructure limits, data quality, existing processes and the people who use the outputs.
I learned that a cloud-based architecture is not automatically a better one. Because some branches could lose internet access for extended periods, I favored local persistence with SQLite. This made the daily workflow less dependent on connectivity, while requiring careful thinking about backups and moving information between locations.
Recording customer, study and transaction information in queryable tables allowed the application to retrieve historical data, filter operations and produce outputs without repeatedly retyping the same information. I became more aware of the importance of consistent formats and data relationships.
Laboratory staff specifically needed Excel documents. Rather than treating that as a limitation to eliminate, I learned to integrate the format into the workflow: query records in Python, transform them into the required structure and generate ready-to-use spreadsheets.
Once transactions were recorded consistently, the same information could support date-range filtering, aggregate summaries and economic reports. I learned to distinguish raw data, revenue, costs and profit—and to be explicit about how each metric is calculated.
The needs of laboratory technicians and administrative staff were different. One group needed patient-oriented operational receipts; another needed financial summaries. Building both reinforced that usability starts with understanding who will consume each output.
Working with sensitive records taught me that useful software also needs careful access, data handling and responsible disclosure. The public portfolio version is intentionally a separate, sanitized demonstration; real records, credentials and company-specific visuals are not included.
This experience strengthened the foundation behind analytics: data collection, persistence, transformation, validation, reporting and communication with the people who use the results.
The portfolio explains the engineering context without identifying patients, exposing private operational data or reproducing proprietary visual assets.
General business requirements, local-first architecture, data workflow, Excel automation, technical learnings and a synthetic-data demonstration.
Actual patient and financial records, physician identities, business contact details, credentials, original artwork and private branch-specific information.