How much history matters?
Compare shorter and longer price-history windows to examine their impact on the behavior learned by the agent.
Deep RL Trading Agent investigates decision-making on historical financial data using a Dueling Deep Q-Network. I reproduced and adapted a reference implementation to compare 3-bar and 10-bar observation windows and explore how simulated transaction commissions affect rewards.
Instead of predicting a price in isolation, an RL agent learns a policy through repeated interactions with a simulated market environment. Its actions influence future rewards and expose the role of trading frictions.
Compare shorter and longer price-history windows to examine their impact on the behavior learned by the agent.
Examine simulated rewards under several commission assumptions, instead of treating trades as cost-free decisions.
Interpret training and evaluation curves carefully without equating simulated reward with verified trading profits.
The environment turns historical stock quotes into an interactive decision process. This simplified representation outlines the environment used in the project.
Relative market features from a configurable number of historical bars, together with information about the simulated trading position.
The policy selects an action at each step. These represent decisions in the simulation, not orders sent to a real exchange.
Rewards depend on simulated market movements, positions and the transaction-cost configuration.
A Dueling DQN estimates action values through separate state-value and action-advantage pathways. The model is trained using replayed experience rather than a supervised label for the “correct” trade.
I explored the impact of observation length and simulated trading fees on the learned policy. The original report documents two window configurations and multiple commission settings.
Represent the state with a shorter recent market history, reducing the amount of temporal context provided to the agent.
View 3-bar plots ↗Provide a longer sequence of past observations to explore whether additional context changes simulated rewards.
View 10-bar plots ↗The saved figures include runs labeled no commission, 0.05%, 0.06% and 0.075%. These are plotted outputs from the original experiment, not a guarantee of statistically significant differences.
Browse all 12 saved figures, organized by observation-window size. The original images are displayed at their natural proportions and can be opened at full size.
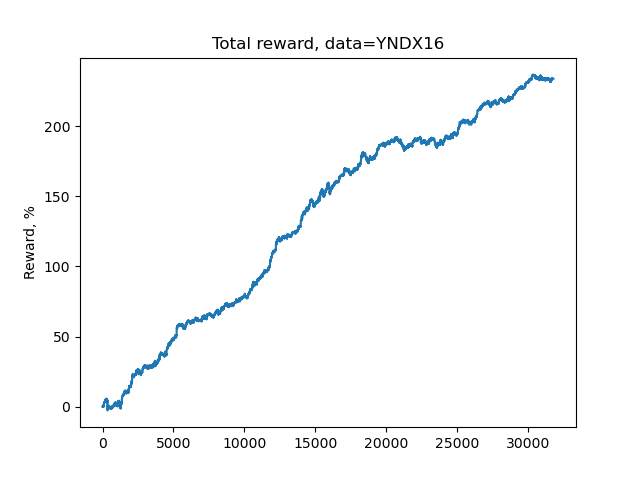 Image not found — check folder and filename
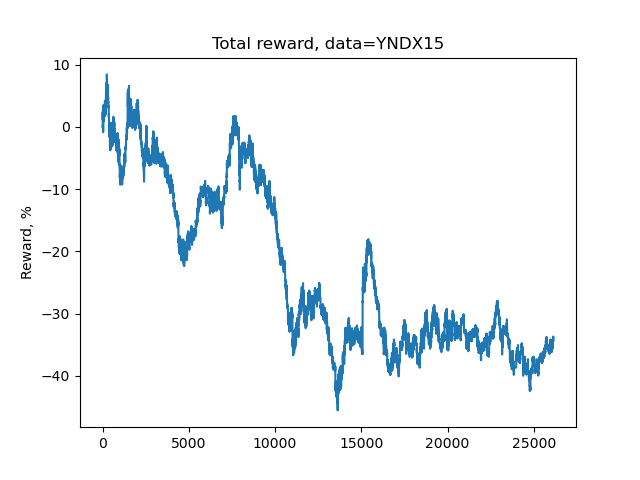 Image not found — check folder and filename
Note: these are the original experiment plots. Axes and reward definitions follow the original implementation; they are not verified net portfolio returns.
The experiment produced reward trajectories for distinct input windows and cost assumptions. Without a standardized out-of-sample benchmark, the plots should be treated as exploratory evidence rather than a profitability claim.
Three versus ten bars changes what the agent sees. Comparing outcomes is useful, but window length alone cannot explain every variation between training runs.
Trading decisions should be evaluated under transaction costs, which can materially affect any frequently trading strategy.
Reliable comparisons would also need chronological holdout data, repeated seeds, explicit return metrics and a buy-and-hold baseline.
The repository combines historical datasets, a custom market simulation, neural models, training scripts and reward visualizations. The code is adapted from an openly credited learning reference.
Read market observations and transform price information into state features for the RL environment.
Implement discrete position actions, state transitions and commission-aware simulated rewards.
Train a Q-value estimator with a policy for exploration and mechanisms for more stable off-policy updates.
Compare observation windows, simulated commission settings and recorded reward behavior across experiments.
The most useful outcome was not a particular trading signal: it was learning to design RL experiments, interpret reward curves and question the validity of financial-model evaluations.
A trained agent is not automatically a useful trading strategy. Reproducing and modifying this experiment helped me connect sequential decision-making with experiment design, evaluation methodology and the limits of historical simulations.
I saw why states, actions and rewards must be designed together. What an agent optimizes depends on how the simulation defines success.
Understanding Dueling DQN, epsilon-greedy exploration, replay buffers and target networks clarified how value-based RL differs from ordinary supervised learning.
Testing 3-bar and 10-bar input windows demonstrated how seemingly small choices in state representation change the problem being learned.
Transaction fees, data chronology and baseline comparisons matter. Reward curves alone are insufficient evidence of generalization or investment performance.
This project motivated a more rigorous view of sequential models: always distinguish simulated feedback from actual performance, isolate experimental variables and evaluate on genuinely unseen future periods.
The work reproduces and adapts a published implementation in an academic context. Its outputs are exploratory and should not be interpreted as investment recommendations or proof of profitable automated trading.
The documented setup trained on 2016 data and evaluated on 2015. This is not a forward-in-time holdout test.
Train on earlier periods, validate on a later period and reserve the latest unseen interval for a final test.
Report portfolio returns and drawdowns, compare against buy-and-hold, repeat random seeds and test greater realism in transaction assumptions.
Code, original report, methodology and saved reward visualizations. The repository credits the source implementation and describes the study's limitations.