01SEGMENTATION
Identify water-related flood labels
Learn a pixel-wise binary mask from labeled satellite images and inspect spatial errors instead of relying on a single accuracy figure.
COMPUTER VISION
FloodScope AI is an end-to-end research project for satellite flood segmentation. I trained and compared U-Net and DeepLabV3+ models, evaluated their performance across geographic regions, and built an interactive Streamlit dashboard. A separate Nepal experiment exposed how badly a model can fail when its input domain changes.
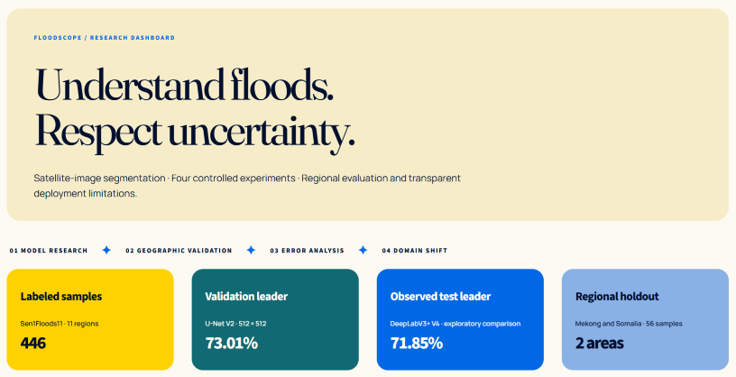
Satellite imagery can support disaster monitoring, but pixel-level segmentation must be evaluated carefully. A visually convincing mask does not automatically represent a dependable flood map.
Learn a pixel-wise binary mask from labeled satellite images and inspect spatial errors instead of relying on a single accuracy figure.
Hold out geographic regions during training so the evaluation tests more than memorization of nearby imagery.
Compare predictions with ground truth and investigate out-of-domain inputs rather than presenting every output as correct.
The project uses the prepared RGB PNG imagery and binary masks supplied in a Sen1Floods11-based dataset. The PyTorch loader reads aligned pairs directly from ZIP archives.
RGB images and matching binary masks.
Train, validation and test use distinct regions.
256 or 512 px; mask nearest-neighbor resize.
Binary loss combinations and horizontal/vertical flips.
Dice, IoU, threshold tuning and region-level errors.
Input format: 3-channel RGB scaled to [0, 1] · Masks: 0 / 255 converted to binary labels · Region-level separation
The region-aware split limits geographic overlap, but it does not by itself establish global generalization. Split sizes are based on the recorded project dataset.
I compared image resolution, loss functions and network architecture rather than selecting a model from a single run.
ResNet18 encoder with BCE + Dice loss. Established the first segmentation baseline.
Higher input resolution, BCE + Dice and mixed precision training. Highest validation Dice.
Compared a different loss formulation to study the precision/recall trade-off.
ResNet18 encoder and atrous spatial processing. Highest observed exploratory test Dice.
Validation performance guided model selection; test results are reported transparently as exploratory comparisons because the test set was consulted during development.
| MODEL | VALIDATION | TEST |
|---|---|---|
| V1 · U-Net 256 | 0.7198 | 0.6528 |
| V2 · U-Net 512 | 0.7301 BEST VAL | 0.6799 |
| V3 · U-Net Tversky | 0.7270 | Not evaluated |
| V4 · DeepLabV3+ | 0.7189 | 0.7185 OBSERVED |
Scores use tuned thresholds where recorded. The held-out test was not preserved as a strictly untouched final benchmark after multiple comparisons.
V2 achieved the highest recorded validation Dice. V4 produced the highest observed test Dice, but that observation alone is not proof of superior real-world performance.
I built a Streamlit research interface to bring model results, segmentation examples, regional performance and the Nepal failure analysis into one place.
Choose images from the labeled dataset, inspect ground truth, run V2 or V4 with local checkpoints, and examine prediction errors.
The interface uses a warm cream-and-blue visual identity, while this portfolio case study retains the site's orange terminal aesthetic.
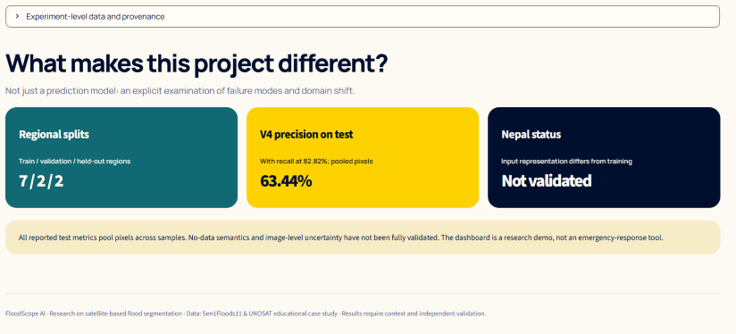
Performance was not uniform across geographic areas. Region-specific evaluation helped expose failure cases that an aggregate metric would obscure.
The model performed substantially better on the recorded Mekong samples.
Performance fell sharply, highlighting a limitation in cross-region generalization.
Averaging across regions can conceal geographic disparities. These observations motivate per-region diagnostics and more representative evaluation rather than claims of universal flood detection.
Using a separate UNOSAT/Nepal VV/VH tile set, I reconstructed exploratory three-channel composites and applied V4. Input channels differed substantially from training imagery.
With a visualization threshold of 0.45, V4 marked approximately 97.7% to 99.7% of pixels positive across the four filtered Nepal examples. These numbers are model outputs—not verified flooded-area percentages.
The original RGB training transformation was not fully reconstructed from the available material. Matching tensor shape and numerical range does not establish SAR equivalence.
The most useful outcome was not a single score. It was learning how dataset design, model selection and uncertainty affect the validity of a computer vision system.
A model's apparent success depends on what the evaluation actually tests. This project pushed me to investigate geographic bias, investigate failures, and communicate results without overclaiming.
A random tile split can exaggerate generalization if nearby imagery appears across sets. Grouping by region made the experiment more meaningful and exposed geographic weaknesses.
Changing resolution, loss function and network architecture produced different trade-offs. Validation and test rankings did not agree, reinforcing disciplined model selection.
The gap between Mekong and Somalia demonstrated why I need to inspect regional results, false positives and false negatives—not just present a headline Dice score.
Exploratory Nepal inference produced overwhelmingly positive predictions. I learned to check SAR preprocessing and input distributions before trusting cross-dataset transfer.
Turning training scripts and JSON metrics into a Streamlit interface made it easier to compare experiments, inspect masks and understand model limitations.
Without Nepal labels and a verified input transformation, it would be misleading to report flooded area or population estimates. Communicating that boundary became part of the engineering work.
FloodScope AI connected deep learning, satellite imagery, data engineering and deployment with a broader understanding of how and why models fail outside their training conditions.
The public repository contains the application and experiment code, documented results and instructions for running the local dashboard. Datasets and model weights are handled separately.
Browse the PyTorch models, training workflows, evaluation scripts, documentation and Streamlit source code.
Open repository ↗Review dataset preparation, model comparison, evaluation assumptions and the documented transfer-domain limitations.
Read documentation ↗